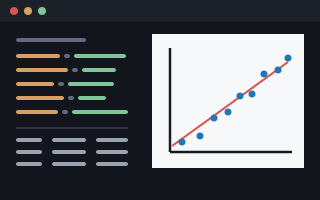
Point it at a CSV file (a table saved as plain text, with commas between the columns) and a spec file, and it prints a statistical report and draws a chart. Nothing is passed on the command line but the spec. Everything else lives in a text file you can keep beside the data and put under version control:
bin/mill run mills/tally/tally.shoddy mills/tally/files/grades.specNamed for the tally: the count kept at the loom, the stick notched as the pieces came off. It is a thin program over thick machines. csv reads the file, stats does every calculation, and plotter draws every chart. What tally adds is the spec file, the dispatch (choosing which verb runs) and the layout.
Flat dotted keys, one per line, # for a comment:
# tally spec - study hours against final marks

data.file      = mills/tally/files/grades.csv

derive.Z       = zscores FINAL
derive.RES     = residuals HOURS FINAL

report.count   = count
report.stats   = describe HOURS MIDTERM FINAL
report.corr    = correl HOURS FINAL
report.line    = fit HOURS FINAL
report.groups  = freq GROUP
report.strays  = outliers FINAL

chart.type     = scatter
chart.x        = HOURS
chart.y        = FINAL
chart.fit      = yes
chart.title    = HOURS AGAINST FINAL MARK

window.size    = 480 320
window.at      = 120 90
window.capture = mills/tally/files/grades.png
window.show    = no
The format is deliberately not [sections]. Sections buy one
thing: saying the prefix once. They cost a state machine in the parser (extra
bookkeeping to remember which section each line is in) and a flattening pass
after it. Dotted keys are the same information with neither cost. And because
every line is a complete statement, a line can be moved, copied or commented
out without reading the twenty above it to find out which section it is
in.
One rule is worth stating on its own: a comment is a line whose
first non-space character is #. There are no trailing
comments. That is not laziness. The spec's own data.comment key
takes # as its value, and a parser that stripped from the
first # onwards would eat it. Trailing comments would need
quoting, quoting needs escaping, and a config file that needs an escaping rule
has stopped being a config file.
The data is ten students, in
mills/tally/files/grades.csv:
STUDENT,GROUP,HOURS,MIDTERM,FINAL
ADA,A,14,88,96
LIN,A,9,71,78
GRACE,B,17,92,99
ALAN,B,11,74,81
EDSGER,A,6,58,61
BARBARA,B,15,85,91
KATHERINE,A,19,94,97
DONALD,B,4,49,52
MARGARET,A,12,79,84
JEAN,B,21,97,98
Five stages run over it, in this order and no other: read, derive, filter, report, draw.
data.*: read itdata.file names the CSV; data.trim drops spaces
around unquoted cells. The first record becomes the header, so from here on
every other line talks about columns by name. (data.sep,
data.comment and data.header are there for files that
are not plain comma-separated with a header row.) The result is a sheet: five
named columns, ten rows.
derive.*: add columnsEach derive line appends one new column to
every row. The key after the dot is the column's name; the value is a verb and
the columns it works on. The sample adds two, and the sheet grows from five
columns to seven:
derive.Z       = zscores FINAL
derive.RES = residuals HOURS FINAL| STUDENT | HOURS | FINAL | Z | RES |
|---|---|---|---|---|
| ADA | 14 | 96 | 0.756 | 8.967 |
| LIN | 9 | 78 | -0.351 | 4.855 |
| GRACE | 17 | 99 | 0.941 | 3.634 |
| ALAN | 11 | 81 | -0.166 | 2.300 |
| EDSGER | 6 | 61 | -1.396 | -3.812 |
| BARBARA | 15 | 91 | 0.449 | 1.189 |
| KATHERINE | 19 | 97 | 0.818 | -3.921 |
| DONALD | 4 | 52 | -1.949 | -7.257 |
| MARGARET | 12 | 84 | 0.018 | 2.522 |
| JEAN | 21 | 98 | 0.879 | -8.476 |
Shown to three places; the columns themselves carry whatever
Str gives.
zscores FINAL restates every mark in standard
deviations from the class mean. A standard deviation is the usual measure of
how spread out the marks are. The mean is 83.7 and the sample SD is 16.262,
so ADA's 96 becomes (96 − 83.7) / 16.262 = 0.756 (three quarters of a standard
deviation above average) and DONALD's 52 becomes −1.949. The point of the
column is that it is comparable. A Z of 0.8 means the same thing in
this class as in any other, where a mark of 96 does not.
residuals HOURS FINAL is the interesting one.
It fits the least-squares line of FINAL on HOURS, the straight line that
comes closest to all the points at once, and the same line
report.line prints: FINAL = 2.778 × HOURS + 48.147.
Then, for each row, it subtracts what that line predicted from what
happened. So it is the column of what the straight line
failed to explain. ADA studied 14 hours, the line expected 87.0, and
she got 96. Her residual is +8.97: she did nine marks better than her hours
alone account for.
Read the bottom of that column and the data answers back. JEAN has the
largest miss at −8.48, and not because she did badly; she scored 98. She put
in 21 hours, and the line, extrapolating, predicted 106.5. Marks stop
at 100. KATHERINE is negative for the same reason. That ceiling is most of why
report.line reports an R² of 0.880 rather than something higher.
(R² says how much of the variation the line explains, on a scale from 0 to 1.)
It is exactly the sort of thing a scatter plot and a residual column show
you, and a correlation coefficient alone does not.
Two rules about ordering are worth knowing:
files/marks.spec does
derive.TOTAL = add MIDTERM FINAL and then
derive.SHARE = pct TOTAL, the second working on a column that did
not exist when the file was opened.filter.keen = above HOURS 10 to this
spec you would get nine rows. But Z would still be the whole class's
z-scores (the ones printed above), not z-scores recomputed among the
survivors. That is deliberate. "How does this student compare to the class" is
usually the question, and standardizing against a subset you just carved out
quietly changes what the number means. If you want the other behaviour, filter
the file first and run tally on that.filter.*: drop rowsThe sample has none, so all ten rows go through. When there are several they
apply in file order, each one narrowing what the last left. The verbs are
above and below (numeric),
equals (text), and inliers /
outliers. Those last two split on the 1.5 × IQR fences (IQR is
the interquartile range, the spread of the middle half of the values), which
is the same rule the box plot draws its whiskers to.
files/share.spec uses one:
filter.keen = above HOURS 10report.*: print itSix lines of spec, six blocks of output, in file order. Each is a verb and the columns it applies to, and each is a word stats already exports:
| Spec line | What it prints |
|---|---|
report.count = count | How many rows survived, and what the columns are now called, the quickest way to see that a derive landed or a filter bit. |
report.stats = describe HOURS MIDTERM FINAL | n, mean, SD, min, quartiles and max, one row per named column. Name no columns and it describes them all. |
report.corr = correl HOURS FINAL | Pearson (0.938) and Spearman (0.952) together. Pearson scores the straight-line relationship; Spearman scores the ranking. Spearman being the higher is the ceiling showing up again: the ranking of hours against marks is tidier than the straight-line relationship is. |
report.line = fit HOURS FINAL | Slope, intercept and
R², the very line derive.RES took its residuals from. |
report.groups = freq GROUP | Counts and percentages of a text column: five in group A, five in B. |
report.strays = outliers FINAL | Anything past the 1.5 × IQR fences. Here: none. |
The whole report is what files/expected.out holds, and what the
headless suite grades line by line.
chart.* and window.*: draw itchart.type = scatter with chart.x and
chart.y puts a dot per row. chart.fit = yes lays the
regression line (the fitted straight line) over them, so the residuals you
can read in the table are the vertical gaps you can see in the picture.
window.size and window.at size and place the window.
window.capture writes the PNG (the picture file) and
window.show = no says the file is the whole output: do not wait
for anyone to dismiss anything.
A derive line names a verb and its columns
(zscores FINAL, residuals HOURS FINAL,
add MIDTERM FINAL) and never an arithmetic expression. That is
the decision the rest of this mill depends on.
An expression language needs a tokenizer, a precedence table, a parser and
its own error messages. Everything it would buy can be had by naming one
more verb. A verb is two lines of Shoddy, and it cannot be got syntactically
wrong by whoever writes the spec. When a verb is missing, the fix is
to add a Case, not a grammar.
Every verb is a thin wrapper over a word stats already exports and already tests. The mill does dispatch and layout; it does no statistics of its own.
| Family | Verbs |
|---|---|
derive.*a new column | zscores
ranks log abs pct
residuals add sub mul
div |
filter.*fewer rows | inliers
outliers above below
equals |
report.*lines of text | count
describe correl fit freq
ttest2 anova outliers |
chart.typea picture | histogram
bar pie box scatter
none |
The order is fixed and matters: derive, then filter, then report. A filter may name a column a derive made, and a report should only ever see the rows that survived. Derives run in file order too, so a later one can name an earlier one's column.
./build.sh run [SPEC]       report, then the chart in a window
./build.sh capture [SPEC]   the same with nothing on screen — the PNG is the output
./build.sh test             the headless suite: no window, no display
./build.sh build            weave the program into bin/
./build.sh clean            remove bin/
On Windows, ./build.ps1 takes the same subcommands. Paths
inside a spec are relative to the directory you run from. The build targets
run from the repo root, so the shipped specs say
mills/tally/files/.... A spec is a small thing you keep beside
your data. A path that meant different things depending on which folder the
spec happened to live in would be a path nobody could read.
capture passes the mill's
--no-window flag, which opens every scribbler hidden. Pair it
with window.show = no in the spec. The two knobs answer two
different questions. window.show is the program's: does
it wait for someone to dismiss the picture, or is the file the whole output?
--no-window is the run's: may this invocation put pixels
on a display?
Three files, and the split is the reason the mill is testable at all:
| File | What's in it |
|---|---|
tally-spec.shoddy | The spec file: the line parser
and the typed accessors over it. A spec is a
dict association list (a list of
key-value pairs), so SpecGet is DictGet with the key
folded to upper case. The total reader returns the line number a bad spec
failed at. |
tally-core.shoddy | Pure. Loading,
the derive/filter/report verbs, the layout, and TallyCheck.
Nothing here reads a file, opens a window or prints; it takes text and gives
back a sheet or a list of lines. |
tally.shoddy | The shell: arguments, files, the window, the picture. Forty lines of scribbler handling and five plotter calls. |
The order of operations in the shell is the part worth copying. The spec is
read, the data is read, the pipeline runs, the report prints,
TallyCheck passes, and only then is a window
opened. A bad spec is a message and an exit code (the number a
program hands back to say how it ended), never a window that appears and then
closes. That matters more than it sounds: Error
under mill run is caught by the program itself, so a window
already on screen would be left standing with nothing behind it.
TallyCheck is why that is possible. Shoddy has no catchable
errors, so a validator that aborted would be no use to a shell trying to decide
whether to open anything. This one returns a string: empty when the
spec is drawable, and a complaint naming the offending key or column when it is
not. It catches an unknown chart type, a missing chart.x, a column
the file does not have, and, the one that matters most in practice, a
filter.* that removed every row.
test.shoddy Includes tally-core.shoddy and
not tally.shoddy, so nothing in the suite can draw even
by accident. It needs no display and no network. The centrepiece runs
files/grades.spec through the whole pipeline and compares the
report against files/expected.out line by line.
A change to any verb, any format string or any statistic shows up as a diff
rather than as a number nobody checked.
What is left untested is the window handling in the shell, and the five plotter calls, which plotter's own suite already grades pixel by pixel.
| Machine | Why | |
|---|---|---|
 | csv | Reads the data file
the spec names, header and all. Every stage of the pipeline is a
CsvSheet in and a CsvSheet out. |
 | dict | A spec is an
association list; DictGet and DictGetOr are what
SpecGet and SpecGetOr are made of. |
 | file | ReadLines
reads the golden report the headless suite grades against. |
 | plotter | All five charts, plus
ScaleTo and PlotColor for the regression line drawn
over the scatter. |
 | scribbler | The window and the event loop that waits for it to be dismissed. |
 | seq | Contains,
Append, Flatten and Zip thread through
every stage. |
 | stats | Every number in
the report and every derived column: Mean, Quantile,
ZScores, Correl, LinFit,
Freq, TTest2, Anova,
Outliers. |
 | str | Split and
Trim take a spec line apart; PadLeft,
PadRight and ToFixed lay the report out in
columns. |
 Shoddy · The Mills